Web Time Analytics: Track and Visualize Your Web Usage
Web Time Analytics is a free Chrome add-on developed by seanpar203 that helps users visualize and track their time spent on specific web pages. With three different forms of presentation, this tool aims to provide a useful breakdown of how users spend their time on the web.
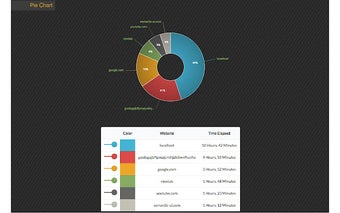
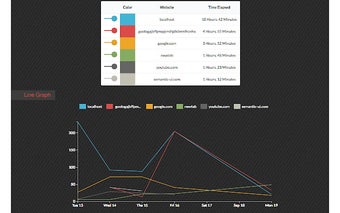
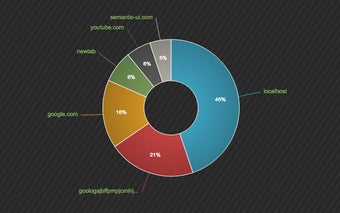
The add-on offers three different ways to visualize data: a pie chart, a table with percentages, and a line chart that can be activated from the table. Every time you switch tabs or open a new tab, Web Time Analytics starts counting your time spent on that page until you switch to a new tab. It then saves the time spent on the previous tab and starts the process again.
The data is displayed in a user-friendly manner, showing only the top six websites visited for the day. The line chart requires at least one day of web usage to display trends, and it can show a maximum of the past six days.
With Web Time Analytics, users can gain insights into their web usage patterns and make more informed decisions about their online activities.